Analytics overview — understanding your wishlist and Back in Stock performance
Overview
The Analytics section helps you measure how customers use your Wishlist and Back in Stock features so you can make better decisions about merchandising, inventory, and marketing.
From one dashboard, you can see:
which products shoppers save most often
how much revenue is influenced by wishlists
how many orders and add-to-cart actions come from wishlist activity
which out-of-stock products still have strong customer demand
Use these insights to identify high-intent products, improve restock planning, and understand which customer actions are leading to sales.
Analytics is most useful when you review it regularly alongside your campaigns, promotions, launches, and restocks. Changes in customer behavior usually become easier to spot when you compare trends over time.
How to access Analytics
Go to Apps and select WC Wishlist & Back in Stock.
In the app navigation, click Analytics.
What you can learn from this dashboard
The Analytics dashboard answers practical questions such as:
Are customers saving products but not buying yet?
Which products create the most purchase intent?
How much revenue is your wishlist feature influencing?
Which out-of-stock products should be restocked first?
Are your campaigns leading to more wishlist activity or conversions?
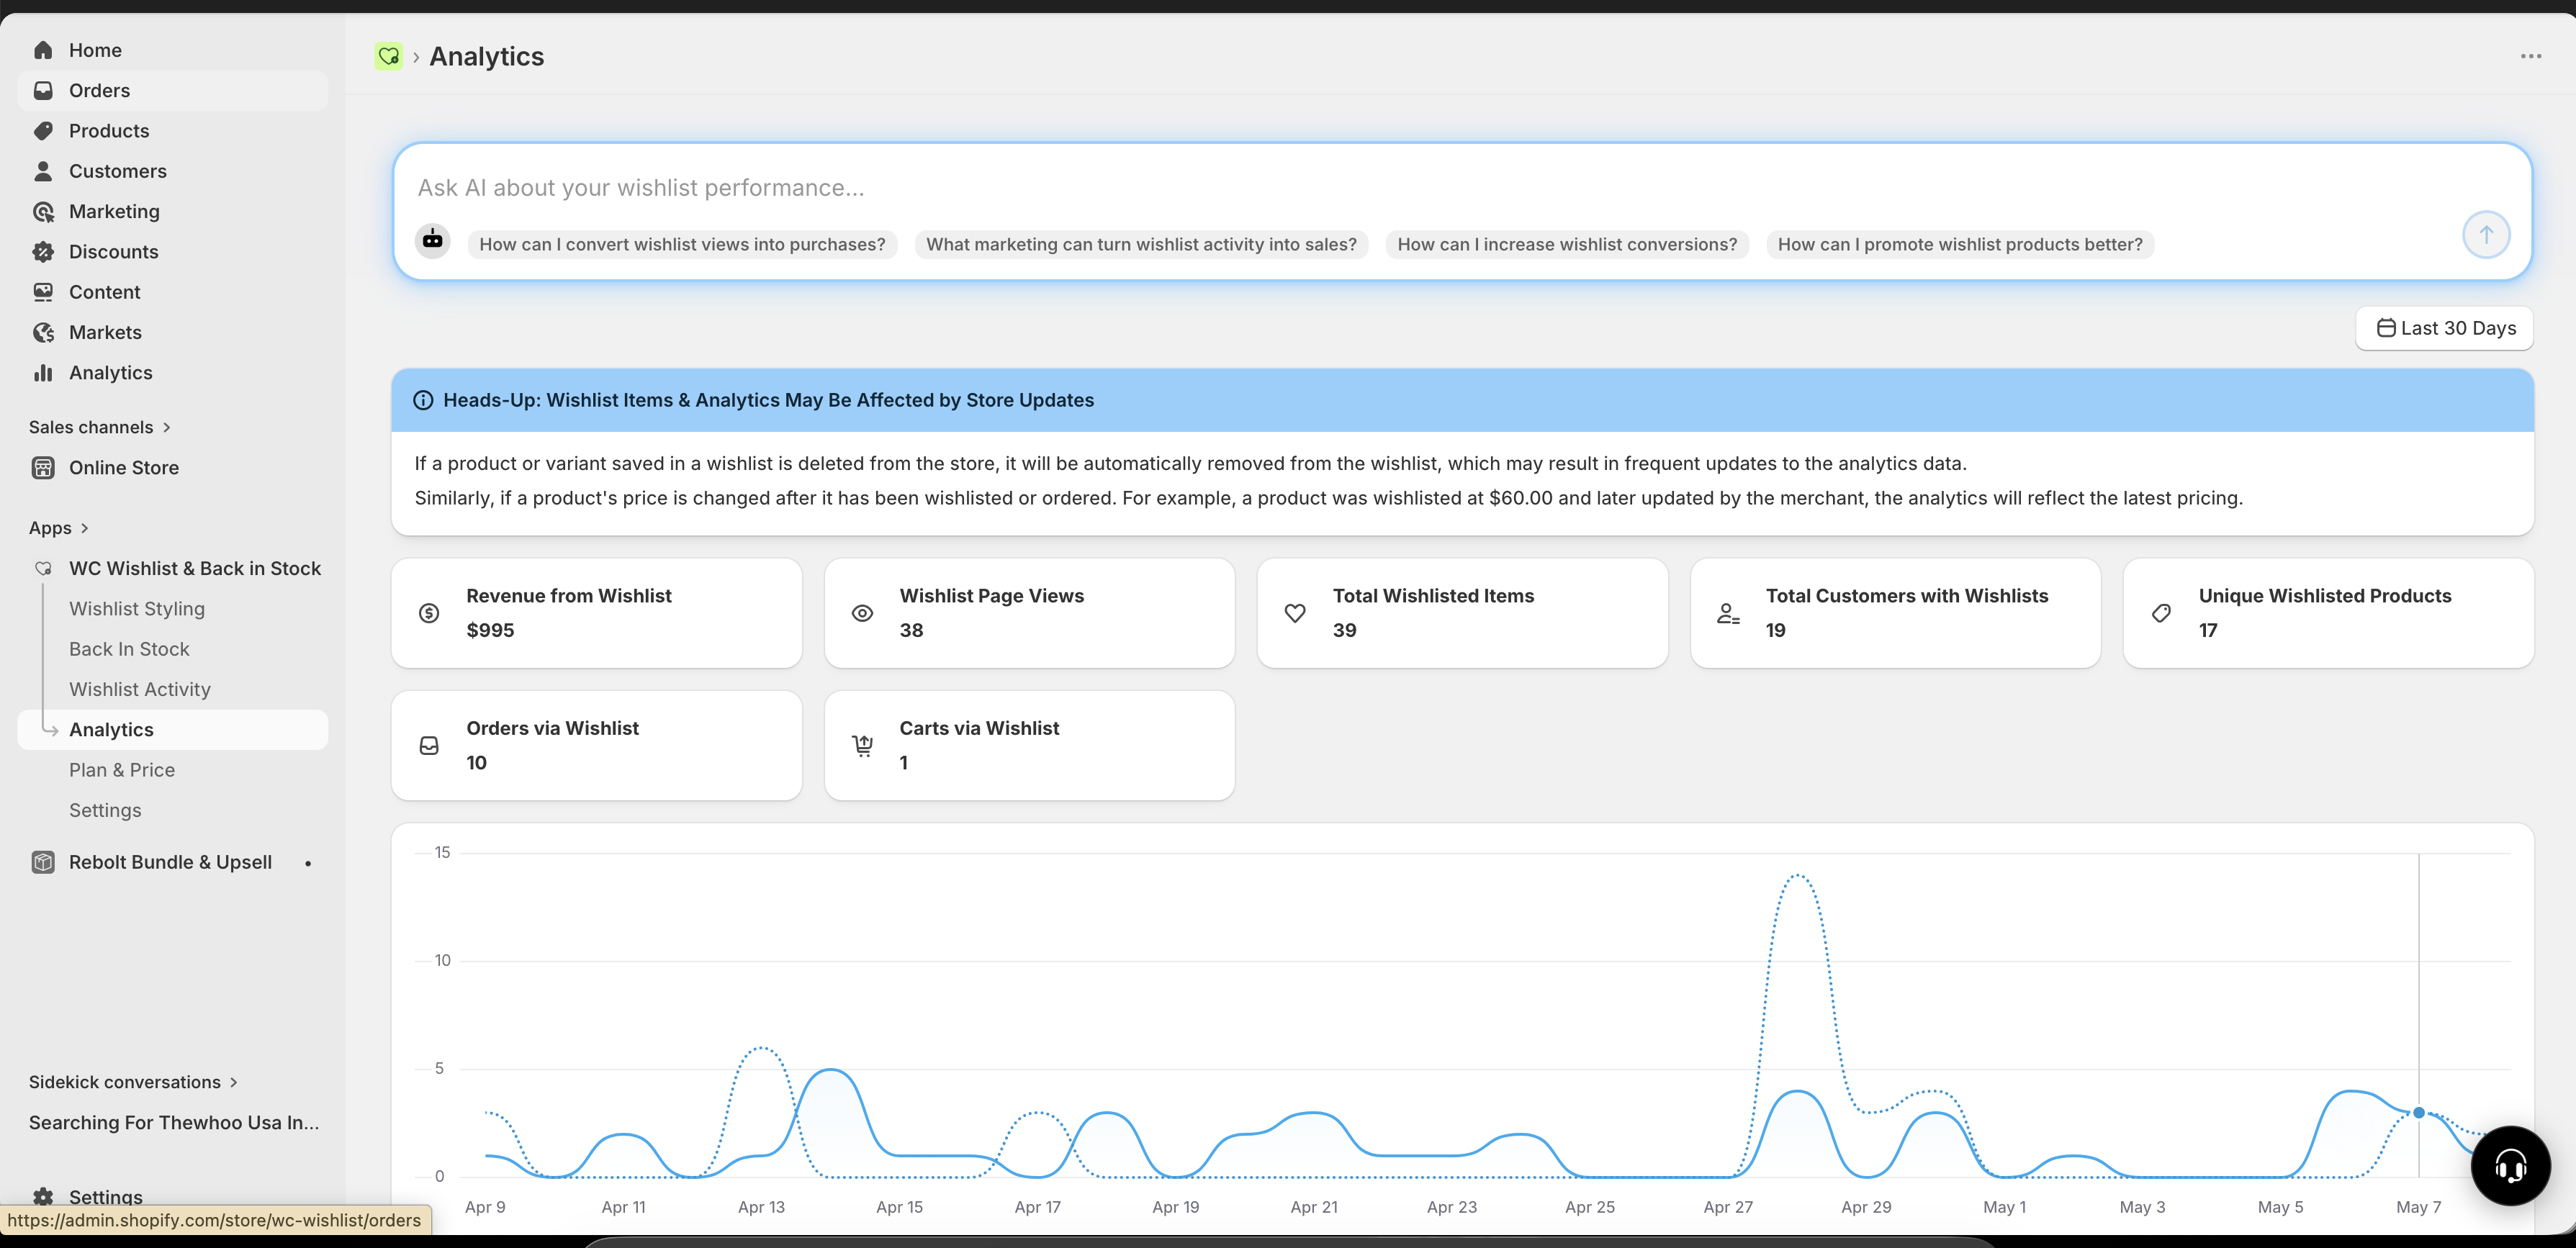
Key metrics at a glance
At the top of the dashboard, you'll see summary cards for your most important performance indicators.
Metric | What it tells you | How to use it |
|---|---|---|
Revenue from Wishlist | Total revenue generated from purchases influenced by wishlist activity. | Use this to understand how much sales value your wishlist feature is creating. |
Wishlist Page Views | How many times customers visited the wishlist page. | Use this to measure ongoing engagement and interest after customers save items. |
Total Wishlisted Items | Total number of product saves across all wishlists. | Use this to track overall customer interest in your catalog. |
Total Customers with Wishlists | How many unique customers have saved at least one item. | Use this to understand how widely the feature is being adopted. |
Unique Wishlisted Products | Number of distinct products that have been wishlisted at least once. | Use this to see whether demand is concentrated in a few products or spread across your catalog. |
Orders via Wishlist | Number of completed purchases that came from wishlist activity. | Use this to measure direct conversion from saved items to orders. |
Carts via Wishlist | Number of add-to-cart actions that started from the wishlist page. | Use this as an early conversion signal, especially when orders take longer to happen. |
Revenue from Wishlist and Orders via Wishlist are your clearest conversion metrics. If both are rising, your wishlist feature is not just being used — it is helping drive sales.
How to read the performance graph
Below the summary metrics, the dashboard includes a trend graph showing wishlist activity over time. This helps you understand not just totals, but when customer behavior changes.
Depending on your dashboard view, the graph may include trends such as:
wishlist additions
wishlist page views
other wishlist-related activity across your selected date range
Use the graph to spot meaningful patterns
Find spikes in interest: A sharp increase in wishlist additions often means a product launch, collection drop, social post, or promotion is getting attention.
Measure campaign impact: After sending an email or running an ad, check whether wishlist views, adds, carts, or orders increase.
Identify seasonal demand: Repeating peaks around holidays, launches, or special events can help you plan stock and promotions earlier.
Compare shorter and longer periods: Use date filters to understand whether a result is a short-term spike or part of a longer trend.
A high number of wishlist additions without a matching rise in orders usually signals strong interest but some purchase hesitation. This can point to price sensitivity, low urgency, out-of-stock items, or a need for follow-up marketing.
Using date filters effectively
Use the date range filter to focus on the period that matches the question you are trying to answer.
Last 7 days: Best for checking the immediate impact of a campaign, promotion, or new launch.
Last 30 days: Best for regular performance reviews and month-over-month comparisons.
Longer ranges: Best for spotting seasonality, product lifecycle trends, and sustained growth or decline.
What to compare
before and after a product launch
before and after a sale or discount period
in-stock vs. out-of-stock periods for the same product
holiday periods vs. normal trading weeks
Understanding wishlist performance
Wishlist analytics help you separate interest from conversion.
Signs that wishlist usage is healthy
customers are regularly saving products
wishlist page views remain steady or grow over time
carts via wishlist and orders via wishlist trend upward
revenue from wishlist grows alongside traffic and saves
What different patterns may mean
High wishlist adds, low orders: Customers want the products, but something is preventing purchase. Check pricing, availability, shipping costs, or whether reminder campaigns are in place.
High page views, low carts: Customers are reviewing saved items but not moving forward. Consider improving urgency, promotions, or product detail quality.
Low feature usage overall: Customers may not be noticing the wishlist feature. Consider making the wishlist button more visible or promoting the feature in your storefront.
Understanding Back in Stock performance
If you use Back in Stock features in the app, analytics also help you identify products with unmet demand.
Look for products that are:
frequently wishlisted
repeatedly viewed while unavailable
saved by many unique customers
associated with strong conversion once inventory returns
How to use this insight
prioritize restocks for products with the highest saved demand
plan replenishment for products that repeatedly generate interest while out of stock
coordinate Back in Stock alerts with your marketing calendar
feature high-demand restocked items in email and onsite promotions
When a product has both strong wishlist activity and repeated out-of-stock demand, it is usually a stronger restock candidate than a product with traffic alone.
Best ways to act on your data
Analytics becomes most valuable when you turn patterns into action. Use the dashboard to guide decisions such as:
Merchandising
feature top-saved products on your homepage or collection pages
highlight products with strong save activity but lower visibility
promote products that frequently convert from wishlists
Inventory planning
restock products with sustained wishlist demand
monitor out-of-stock products that continue attracting saves or views
use demand signals to reduce missed sales opportunities
Marketing
build campaigns around top-wishlisted products
follow up on products with many saves but low order conversion
measure whether reminder campaigns increase carts and orders
A simple review routine
If you want a practical way to use Analytics consistently, follow this routine:
Check revenue from wishlist, orders via wishlist, and carts via wishlist to understand whether customer intent is turning into sales.
Identify products with high save activity, especially if they are seasonal, newly launched, or currently unavailable.
Match spikes or drops against campaigns, launches, promotions, and stock changes.
Restock a product, promote a top-saved item, improve visibility of the wishlist feature, or follow up with a campaign.
Use the next reporting period to confirm whether your action improved views, carts, orders, or revenue.
How to interpret results with confidence
This usually means customer interest is growing faster than conversion. Common reasons include pricing, low urgency, products being out of stock, or customers using wishlists to plan future purchases.
Customers may be saving products on one visit and returning later through a different path, or they may still be considering the purchase. In this case, look at carts via wishlist and page views alongside completed orders for a fuller picture.
Start with Revenue from Wishlist, Orders via Wishlist, and your most-saved products. These usually give the clearest picture of business impact and product demand.
Weekly is a strong starting point for most stores. During major campaigns, launches, or restocks, check more frequently so you can respond faster to changes in demand.
Best practices
Review trends over time instead of relying on a single day of data.
Compare wishlist metrics with your campaign calendar so changes have context.
Pay close attention to products with high saves and low stock availability.
Use carts and orders together to understand where customers drop off.
Prioritize actions that connect demand signals to revenue, such as restocks and reminder campaigns.
Do not judge performance from one metric alone. For example, a rise in wishlist saves is positive, but it should be reviewed together with page views, carts, orders, and stock availability before making major business decisions.